Probably?
(Mainly) bayesian data analysis with a philosophical twist
False positives in DNA identification 5
In a few recent posts we discussed the error probability for false positives in DNA evidence evaluation. Now, let’s think about the error probability for false negatives and its impact on the value of exculpatory DNA evidence. Consider the probability of no match being reported if an error has been made, analogus to k in the previous calculations:
\begin{align} l = \mathsf{P}(\neg R \vert E, S) = \mathsf{P}(\neg R \vert E, \neg S) = \mathsf{P}(\neg R\vert E) \end{align}
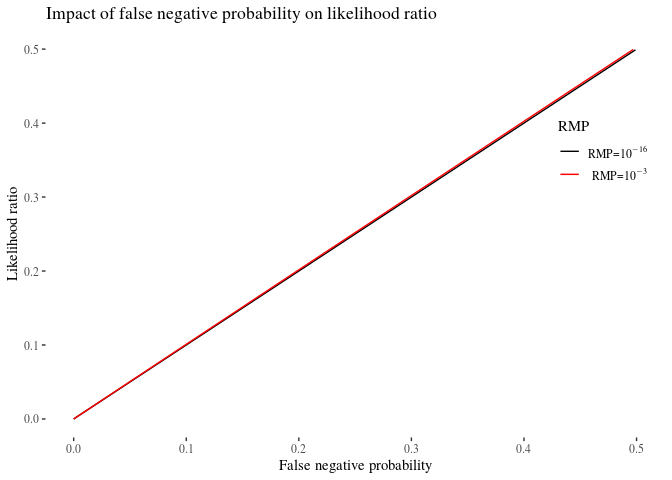
Now, the likelihood ratio calculations, assuming l = 1, go as follows:
\begin{align} \mathsf{LR}(\neg R, S, \neg S) = \frac{\mathsf{P}(\neg R \vert S)}{\mathsf{P}(\neg R \vert \neg S)} \end{align} \begin{align}= \frac{\mathsf{P}(\neg R \vert \neg E, S)\mathsf{P}(\neg E \vert S) + \mathsf{P}(\neg R \vert E, S)\mathsf{P}(E \vert S)} {\mathsf{P}(\neg R \vert \neg E, \neg S)\mathsf{P}(\neg E \vert \neg S) + \mathsf{P}(\neg R \vert E,\neg S)\mathsf{P}(E \vert \neg S)} \end{align} \begin{align}= \frac{0 (1-e) + le} {(1-RMP)(1-e) + le} \end{align} \begin{align}= \frac{le} {1- RMP - e + eRMP + le} = \frac{le}{1-RMP + e(l + RMP -1)} \end{align} \begin{align}= \frac{e}{1 - RMP + eRMP} = \frac{e}{1+(e-1)RMP} \end{align}
If the error rate is 0, then the numerator is 0 and so is the , as it should. In such a case, the evidence is completely exculpatory, the posterior probability that the suspect is the source will be also 0. If the error rate is not 0, the numerator simply is the probability of error, and the numerator takes values between 1 − RMP and 1, depending on the value of e. Quite crucially, 1 in the denominator is decreased by (1−e)RMP, which with usually very low RMP in the case of DNA evidence is a very small change as compared to one, so the denominator stays very close to 1 even if e is very high, and the effectively simply is $\approx \frac{e}{1} = e$. The lines in Figure , strictly speaking, do not overlap, but the difference between them (with RMP being fairly low) is negligible.
rmp9 <- 10e-16
rmp3 <- 10e-3
fnp <- seq(0,0.5, by = 0.001)

lr9n <- fnp/(1 + ((fnp -1) * rmp9))
lr3n <- fnp/(1 + ((fnp -1) * rmp3))

fnpTable <- data.frame(fnp,   lr9n,  lr3n)

library(tidyr)
fnpTableLong <- gather(fnpTable,line,value,c(lr9n,lr3n), factor_key=TRUE)


ggplot(fnpTableLong, aes(x=fnp,y=value, color = line))+  geom_line()+theme_tufte()+ylab("Likelihood ratio")+xlab("False negative probability") +scale_color_manual(values = c(1,2),labels =
              c(expression(paste("RMP=",10^{-16})),expression(paste("RMP=",10^{-3}))))+ggtitle("Impact of false negative probability on likelihood ratio")+ theme(legend.position = c(0.9,.7))+ylim(c(0,0.5))+ labs(color = "RMP")
Interestingly, the situation is not symmetric when we compare FPP to FNP. Recall from the previous posts that with FPP, the likelihood ratio is 50 when e = 0.01 for RMP = 10−3, while for the same e and RMP it is 0.01 for FNP, an hundredfold decrease. This illustrates that the exculpatory value of DNA evidence is higher than its incriminating value, even if the error rates and random match probabilities are the same.
Some conceptual symmetry can be regained though. Suppose $RMP$ is really low as compared to $FPP$ and let’s ignore it in our approximation. Then, the likelihood ratio of the incriminating evidence becomes $\frac{1}{FPP}$ and the likelihood ratio of exculpatory evidence becomes $\frac{FNP}{1}$. However, the change rate of these differ. While $\frac{d}{dx}(\frac{1}{x}) = \frac{d}{dx} (x^{-1}) = - \frac{1}{x^2}$, $\frac{d}{dx}(\frac{x}{1})=1$, and the derivatives look quite different.
x <- seq(0, 1, by = 0.01)
dfn <- rep(1, length(x) )
dfp <- -1/(x^2)

ggplot()+geom_line(aes(x=x,y=dfp, color = "incriminating"))+geom_line(aes(x=x,y=dfn, color = "exculpatory"))+ylim(c(-10,2))+theme_tufte()+
  theme(legend.position = c(0.8, 0.2), legend.title = element_blank())+ylab("likelihood ratio")+xlab("error rate")
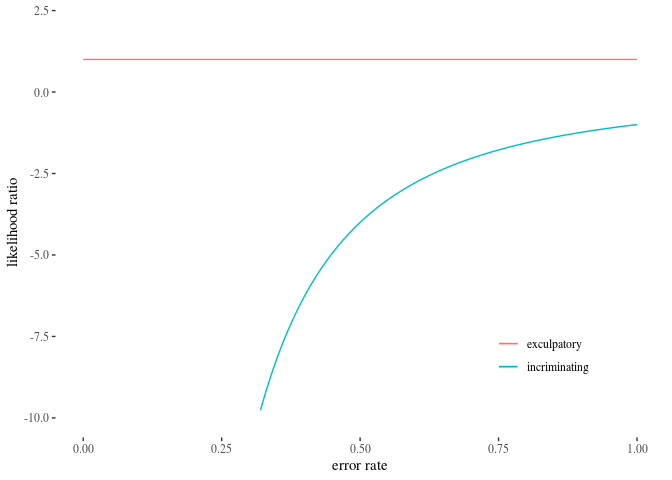
The key lesson from this section is as follows. First, likelihood ratios are useful in the evaluation and comparison of the impact of positive an negative error rates: and it makes clear that this impact is not the same, contrary to what one may intuitively think. Second, the likelihood ratio analysis reveals that even a seemingly small error rate in a sense trumps random match probability: if you think there are good reasons to worry about random matches, the analysis shows that there are much better reasons to worry about error rates. While in fact error rates have not been properly studied, the above application of likelihood ratio to investigate the potential impact of hypothetical error rates is still useful in guiding further research, as it clearly suggests that error rates may have serious impact on the value of various types of evidence, and so require attention.
Written on October 11th, 2021 by Rafal Urbaniak